May 2022 Stakeholder Report
COPAFS News
2022 ICPSR Summer Program: Stats and Methods Courses
Registration is now open for the 2022 ICPSR Summer Program in Quantitative Methods of Social Research. Founded in 1963, the ICPSR Summer Program offers rigorous, hands-on training in statistics, quantitative and qualitative methods, and data analysis for students, faculty, and researchers of all skill levels and backgrounds. All 2022 courses will be offered in a hybrid format, and participants can choose to attend either in-person or online. For more information, visit ICPSR or contact sumprog@icpsr.umich.edu.
Upcoming Events
COPAFS Quarterly Meeting: June 3
COPAFS will hold its next Quarterly Meeting on Friday, June 3, 2022. The meeting will be virtual and will feature the heads of the federal statistical agencies.
47th Annual IASSIST Conference: June 7-10
The 47th Annual IASSIST Conference will take place in Gothenburg, Sweden. The conference theme is “Data by Design: Building a Sustainable Data Culture”. For more information, click here.
2022 NAPHSIS Annual Meeting: June 12-15
The 2022 NAPHSIS Annual Meeting will take place in Omaha, NE. The conference theme is “Reunite, Recalibrate, Reignite.” For more information, click here.
2022 AAEA Annual Meeting: July 31 – August 2
The 2022 Agricultural and Applied Economics Association Annual Meeting will take place in Anaheim, CA. For more information, click here.
APA 2022: August 4-6
The 2022 American Psychological Association Annual Meeting will take place in Minneapolis and virtually. For more information, click here.
RSS 2022 Annual Meeting: August 4-7
The Rural Sociological Society will host its Annual Meeting in Denver, CO. For more information, click here.
117th ASA Annual Meeting: August 5-9
The American Sociological Association will host its Annual Meeting in Los Angeles, CA. The conference theme is “Bureaucracies of Displacement.” For more information, click here.
2022 JSM: August 6-11
The Joint Statistical Meetings will take place in Washington, DC. The conference theme is “Statistics: A Foundation for Innovation.” For more information, click here.
2022 FCSM Research and Policy Conference: October 25-27, 2022
The 2022 FCSM Research and Policy Conference has been scheduled for October 25-27, 2022. Registration for the conference will open in June/July. The conference is being planned as an in-person event at the Washington Convention Center. For more information, click here.
Agency Releases
Bureau of Economic Analysis (DOC)
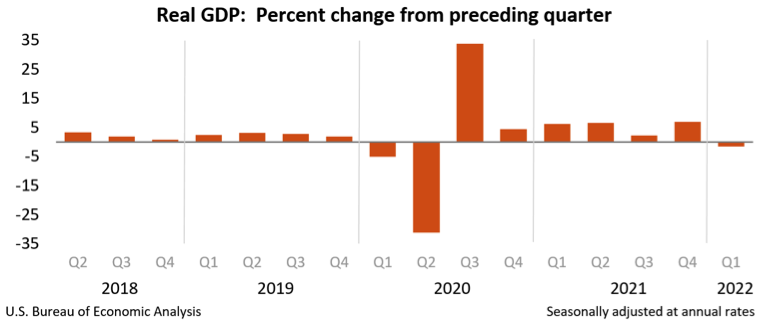
- On May 26, Gross Domestic Product (Second Estimate) and Corporate Profits (Preliminary), First Quarter 2022 was released. Real gross domestic product (GDP) decreased at an annual rate of 1.5 percent in the first quarter of 2022, according to the “second” estimate released by the Bureau of Economic Analysis. In the fourth quarter, real GDP increased 6.9 percent. The GDP estimate released today is based on more complete source data than were available for the “advance” estimate issued last month. In the advance estimate, the decrease in real GDP was 1.4 percent.
- On May 4, US International Trade in Goods and Services, March 2022 was released. The goods and services deficit was $109.8 billion in March, up $20.0 billion from $89.8 billion in February, revised.
Bureau of Justice Statistics (DOJ)
- On May 31, Incidence of Victimization at School and Away from School was released. In 2020, students ages 12 to 18 experienced 285,400 victimizations at school and 380,900 victimizations away from school. From 2019 to 2020, the total victimization rate at school decreased from 30 victimizations per 1,000 students to 11 victimizations per 1,000 students—a decrease of more than 60 percent. The total victimization rate away from school in 2020 (15 victimizations per 1,000 students) was not statistically different from the rate in 2019.
- On May 25, HIV in Prisons, 2020 – Statistical Tables were released. In 2020, an estimated 11,940 persons with HIV were in the custody of state and federal correctional authorities, down from 14,180 in 2019. The number of federal prisoners living with HIV decreased 23%, from 1,477 at yearend 2019 to 1,144 at yearend 2020, while the number in state prison declined 15%, from 12,710 to 10,790.
Bureau of Labor Statistics (DOL)
- On May 26, Productivity by State – 2021 was released. Labor productivity in the private nonfarm sector rose in 39 states and the District of Columbia in 2021. Output increased in all 50 states and the District of Columbia in 2021, following a year of decline for all areas. Hours worked increased in all 50 states but declined in the District of Columbia. Washington and New Hampshire experienced the highest growth in labor productivity of 6.4 percent and 5.2 percent, respectively.
- On May 25, the County Employment and Wages Summary – Fourth Quarter 2021 was released. From December 2020 to December 2021, employment increased in 334 of the 343 largest U.S. counties. In December 2021, national employment increased to 148.3 million, a 5.2-percent increase over the year, as measured by the Quarterly Census of Employment and Wages (QCEW) program.
Bureau of Transportation Statistics (DOT)
- On May 25, North American Transborder Freight, March 2022 was released. Total transborder freight: $141.9 billion of transborder freight moved by all modes of transportation, up 23.8% compared to March 2021. Freight between the U.S. and Canada totaled $72.9B. Freight between the U.S. and Mexico totaled $69.0B. Trucks moved $85.5 billion of freight, up 15.7% compared to March 2021.
- On May 11, the March 2022 Freight Shipment Index was released. The Freight Transportation Services Index (TSI), which is based on the amount of freight carried by the for-hire transportation industry, rose 0.7% in March from February, rising for the seventh consecutive month. From March 2021 to March 2022 the index rose 3.8 percent compared to a rise of 0.5 percent from March 2020 to March 2021 and a decline of 2.2 percent from March 2019 to March 2020
Census Bureau (DOC)
- On May 25, the 2021 Annual Survey of Public Employment & Payroll was released. In March 2021, state and local governments employed 18.8 million people, a decrease of 4.6 percent from the 2020 figure of 19.7 million. Nationally, local government workers comprised the majority of the state and local government workforce with 13.6 million employees (72.1 percent).
- On May 19, the 2020 Undercount and Overcount Rates by State and DC were released. 37 states (or state equivalent) did not have estimated statistically significant undercounts or overcounts. 14 states (or state equivalent) are estimated to have had an undercount or overcount – a net coverage error statistically different from zero – meaning they were either undercounted or overcounted. Undercount: Arkansas (-5.04%), Florida (-3.48%), Illinois (-1.97%), Mississippi (-4.11%), Tennessee (-4.78%) and Texas (-1.92%). Overcount: Delaware (+5.45%), Hawaii (+6.79%), Massachusetts (+2.24%), Minnesota (+3.84%), New York (+3.44%), Ohio (+1.49%), Rhode Island (+5.05%) and Utah (+2.59%).
Economic Research Service (USDA)
- In May, Health Care Access Among Self-Employed Workers in Nonmetropolitan Counties was released. Health insurance coverage rates and sources differed more by age and by whether workers were self-employed than by whether workers lived in a metro or nonmetro location. In 2018, self-employed working-age adults were more likely to be uninsured than those employed by government or other employers. However, a household with both self-employed and private- or government-employed workers was nearly three times less likely to be completely uninsured than one solely self-employed.
- In May, a working paper, Single Commodity Export Dependence and the Impacts of COVID-19 in Sub-Saharan Africa was released. This working paper illuminates the impact that volatility in international commodity prices has on U.S. agricultural product export volumes to sub-Saharan Africa (SSA). The current Coronavirus (COVID-19) crisis has created such a period of intense price volatility, offering a unique opportunity for modeling potential effects of a global shock on trade with these nations.
Energy Information Administration (DOE)
- On May 31, US Movement of Crude Oil by Rail, March 2022 was released.
- On May 26, the Uranium Marketing Annual Report was released. Owners and operators of U.S. civilian nuclear power reactors (civilian owner/operators, or COOs) purchased a total of 46.7 million pounds U3O8e (equivalent1) of deliveries from U.S. suppliers and foreign suppliers during 2021, at a weighted-average price of $33.91 per pound U3O8 The 2021 total of 46.7 million pounds U3O8e was 4% lower than the 2020 total of 48.9 million pounds U3O8e. The 2021 weighted-average price of $33.91 per pound U3O8e was 2% higher than the 2020 weighted-average price of $33.27 per pound U3O8e.
National Agricultural Statistics Service (USDA)
- On May 25, the Commercial Floriculture Survey was released. Of the 10 largest states, Florida had the highest sales, followed by California. Combined, these two states accounted for nearly one-third of all sales in the United States.
- On May 12, it was forecast that Winter Wheat Production will be down in 2022. U.S. farmers are expected to produce 1.17 billion bushels of winter wheat this year, according to the Crop Production report. In NASS’s first winter wheat production forecast for 2022, production is expected to decrease 8% from 2021. As of May 1, the U.S. yield is expected to average 47.9 bushels per acre, down 2.3 bushels from last year’s average of 50.2 bushels per acre.
National Center for Education Statistics (DOEd)
- On May 31, the Condition of Education was released. The Condition of Education contains key indicators on all levels of education, labor force outcomes, and international comparisons. The indicators summarize important developments and trends using the latest statistics, which are updated throughout the year as new data become available.
- On May 11, Revenues and Expenditures for Public Elementary and Secondary Education: FY 20 was released. Current expenditures per pupil on a national basis slightly increased by 0.7 percent to $13,489 between FY 19 and FY 20, following an increase of 2.2 percent between FY 18 and FY 19, after adjusting for inflation. Increases in current expenditures per pupil from FY 19 to FY 20 were among the five highest in New Mexico (9.3 percent), Illinois (5.7 percent), Kansas (4.0 percent), Texas (3.7 percent), and Indiana (3.7 percent).
National Center for Health Statistics (CDC)
- On May 23, Births: Provisional Data for 2021 was released. The provisional number of births for the United States in 2021 was 3,659,289, up 1% from 2020 and the first increase in the number of births since 2014. The general fertility rate was 56.6 births per 1,000 women aged 15–44, up 1% from 2020 and the first increase in the rate since 2014.
- On May 16, Wireless Substitution: Early Release of Estimates from the National Health Interview Survey, July-December 2021 was released. Estimates in this report are based on the second six months of 2021. During this time period, 68.7% of adults and 79.1% of children lived in wireless-only households.
National Center for Science and Engineering Statistics (NSF)
- On May 31, Student Achievement in Science, Selected Results from NAEP was released. In all grades tested, a smaller percentage of students who are eligible for free or reduced-price programs score NAEP Proficient or above in science, compared with students who are not eligible. For example, 52% of students in grade 4 who are not eligible for free or reduced-price lunch score proficient or above in science, compared with 20% of grade 4 students who are eligible.
- On May 6, a working paper, entitled, “An Occupational Approach to Analyzing Regional Invention” was released. The purpose of this working paper is to refine and evaluate the occupation-driven approach for analyzing regional invention suggested by Wojan, Dotzel, and Low (2015), who argue that patenting rates should be computed on the subset of workers that might plausibly contribute to patenting. The authors introduce several modifications to their original analysis, including use of a special tabulation of more detailed occupation data and added controls for regional characteristics that could confound identification of the inventive class—the group of occupations most associated with patent production. The authors then critically evaluate the findings by implementing a simultaneous equations model of the interrelationship between the composition and productivity of the inventive class.
Statistics of Income Division (IRS)
- In May, State and County Migration Data, 2019-2020 was released. These data show the migration between both States and counties in separate datasets. The data include migration flows at the State level, by size of adjusted gross income and age of the primary taxpayer, and are based on year-to-year address changes reported on individual income tax returns filed with the IRS. The data present migration patterns by State or county for the entire United States and are available for inflows (the number of new residents who moved to a State or county and where they migrated from) and outflows (the number of residents who left a State or county and where they moved to).
Federal Register Notices
There were 22 federal register notices posted by federal statistical agencies from April 26, 2022 to May 25, 2022. Links to each of these notices are organized by agency below.
Bureau of Economic Analysis (DOC) – No New Notices
Bureau of Justice Statistics (DOJ) – 3 New Notices
| Date | Notice | URL |
|---|---|---|
| 5/13/2022 | Agency Information Collection Activities; Proposed eCollection eComments Requested; Existing Collection in Use Without an OMB Control Number: AVUE Digital Services-Electronic Applications | Link |
| 5/2/2022 | Hearings of the Review Panel on Prison Rape | Link |
| 4/26/2022 | Agency Information Collection Activities; Proposed Collection Comments Requested; New Collection: National Pretrial Reporting Program (NPRP) | Link |
Bureau of Labor Statistics (DOL) – 2 New Notices
| Date | Notice | URL |
|---|---|---|
| 5/23/2022 | Technical Advisory Committee; Notice of Meeting and Agenda | Link |
| 4/27/2022 | Data Users Advisory Committee; Notice of Meeting and Agenda | Link |
Bureau of Justice Statistics (DOT) – No New Notice
Census Bureau (DOC) – 5 New Notices
| Date | Notice | URL |
|---|---|---|
| 5/25/2022 | Agency Information Collection Activities; Submission to the Office of Management and Budget (OMB) for Review and Approval; Comment Request; Special Census Program | Link |
| 5/24/2022 | Agency Information Collection Activities; Submission to the Office of Management and Budget (OMB) for Review and Approval; Comment Request; Certification of Identity (Form BC-300) | Link |
| 5/4/2022 | Agency Information Collection Activities; Submission to the Office of Management and Budget (OMB) for Review and Approval; Comment Request; Current Population Survey, School Enrollment Supplement | Link |
| 5/2/2022 | Agency Information Collection Activities; Submission to the Office of Management and Budget (OMB) for Review and Approval; Comment Request; U.S. Census-Age Search | Link |
| 4/28/2022 | Agency Information Collection Activities; Submission to the Office of Management and Budget (OMB) for Review and Approval; Comment Request; Annual Survey of School System Finances | Link |
Economic Research Service (USDA) – No New Notices
Energy Information Administration (DOE) – 3 New Notices
| Date | Notice | URL |
|---|---|---|
| 5/23/2022 | Agency Information Collection Extension – Collection of Qualitative Feedback on Agency Service Delivery | Link |
| 5/23/2022 | Agency Information Collection Proposed Extension – Electric Power & Renewable Electricity Surveys | Link |
| 5/6/2022 | Agency Information Collection Proposed Extension – Petroleum Supply Reporting System (PSRS) | Link |
National Agricultural Statistics Service (USDA) – No New Notices
National Center for Education Statistics (DOEd) – 7 New Notices
| Date | Notice | URL |
|---|---|---|
| 5/20/2022 | Applications for New Awards; Child Care Access Means Parents in School Program | Link |
| 5/10/2022 | Agency Information Collection Activities; Submission to the Office of Management and Budget for Review and Approval; Comment Request; NCES System Clearance for Cognitive, Pilot, and Field Test Studies 2022-2025 | Link |
| 5/3/2022 | Agency Information Collection Activities; Comment Request; 2023-24 National Postsecondary Student Aid Study (NPSAS:24) Field Test-Institution Contacting and List Collection | Link |
| 4/27/2022 | National Assessment Governing Board; Meeting | Link |
| 4/27/2022 | Applications for New Awards; Education Innovation and Research (EIR) Program-Expansion Grants | Link |
| 4/27/2022 | Applications for New Awards; Education Innovation and Research (EIR) Program-Early-Phase Grants | Link |
| 4/27/2022 | Applications for New Awards; Education Innovation and Research (EIR) Program-Mid-Phase Grants | Link |
National Center for Health Statistics (HHS) – 1 New Notice
| Date | Notice | URL |
|---|---|---|
| 5/13/2022 | Agency Forms Undergoing Paperwork Reduction Act Review – National Vital Statistics Report Form | Link |
National Center for Science and Engineering Statistics (NSF) – 1 New Notice
| Date | Notice | URL |
|---|---|---|
| 5/4/2022 | Agency Information Collection Activities: Comment Request; National Survey of College Graduates | Link |
Office of Research, Evaluation & Statistics (SSA) – No New Notices
Statistics of Income Division (IRS) – No New Notices